
Nevada Irrigation District Water and Climate Change

Planning for the future in the face of climate crisis
Today, the Nevada Irrigation District (NID) faces the new challenge of planning for climate change impacts. NID is already seeing the impacts through increased temperatures and changes in precipitation patterns.
Understanding the potential impacts of climate change on future water supply is critical to ensuring a long-term reliable water supply. Given how much is at stake, NID has implemented the Plan for Water (PFW) project, which is a long-range decision tool to guide NID’s water management.
Through public collaboration, the PFW will develop a range of potential scenarios for the NID’s Board of Directors to consider when determining the best ways to meet the community’s demand for water for the next 50 years.
What is climate change?
Climate change refers to long-term alteration in temperatures and weather patterns, specifically it relates to temperature and precipitation.
Due to NID’s reliance on winter snowpack in the Sierra, climate change has potential for a profound affect on operations and water reliability.
Using science to model the future

To study climate change impacts on NID’s service territory and watershed, our expert scientific consultant team uses Global Climate Models (GCMs). GCMs are 3D mathematical representations of the major world-wide climate components such as the atmosphere, land surface, ocean, and sea ice. GCMs simulate how these components interact, resulting in scientifically based projections of how these climate interactions may happen. To make sure the models work, scientists have applied projections to past known conditions for accuracy.
For the PFW, the consultant team has selected seven GCMs that best represent the California climate. Each GCM simulated up to three different scenarios that examine potential pathways to projected future climate conditions.
A total of eighteen different scenarios were analyzed. From these, three scenarios were identified for further analysis and understanding. Two of the selected scenarios represent hydrological bookends: the low bookend (dryer hydrology) and the high bookend (wet hydrology). The third scenario represents a median condition (a middle-of-the-road hydrologic climate. Hydrology data uses the “water year,” which runs from Oct 1 to Sep 30. Therefore, the 2023 water year begins on Oct 1 of 2022 and ends on Sep 30 of 2023.
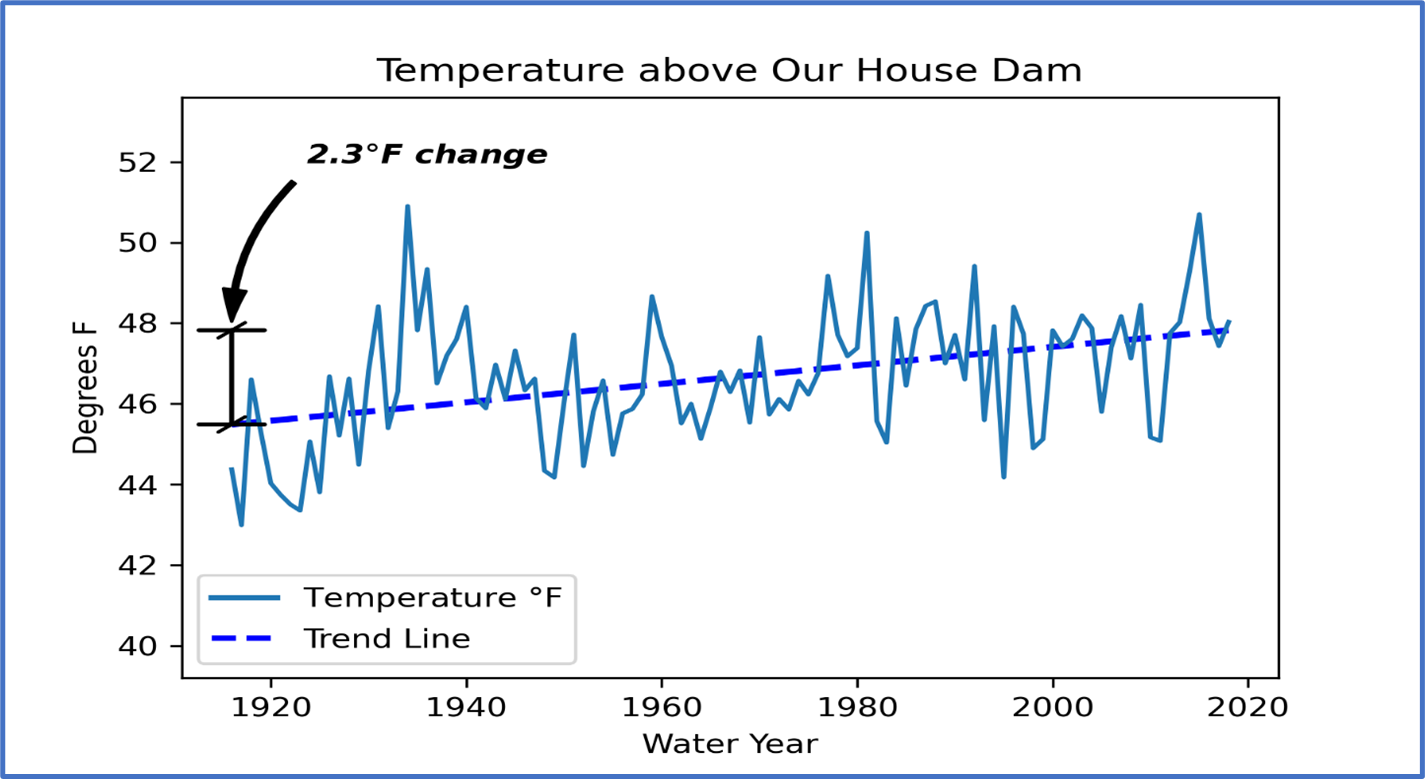
Temperature – higher temps in NID watersheds
Global warming has raised global surface temperature about 2° F higher than those temperatures experienced in the 1900s, as shown in Figure 3.
Generally, an increase in temperatures will make the soils dryer and increase evapotranspiration resulting in higher water losses and reduced inflows.

Global warming is also local warming: higher temperatures in the NID watersheds
Temperatures projected to increase over time
Average temperatures are projected to increase in the rainy season and remain higher than historical temperatures throughout the entire year.

Precipitation – not projected to change significantly
Precipitation is either rain or snow that falls to the ground within the NID watershed.
In NID watersheds, precipitation is not really projected to change significantly.
The January–February precipitation is similar in both the historical and the projected simulations. A similar result is shown for the March–April and for the entire water year. This means that the models do not show a significant change in precipitation within the NID basin.

Snow – less snowpack that melts faster

NID’s mountainous upper watershed acts as a natural reservoir, releasing snowmelt runoff during the spring and summer months.
Climate change impacts will result in less snowpack and faster melting of the snowpack. The NID system was designed and is currently operated to take advantage of the snow cycle and the timing of the resulting runoff.
A large portion of the NID watershed is above the 5,000-foot elevation where snow falls during winter storms. This area is impacted by higher winter and spring temperatures.
Projections indicate that some of what currently falls as snow will fall as rain, reducing the future average snowpack and snowmelt.
This reduction in annual average snowmelt is an important consideration because historically, NID has used this snowmelt runoff to meet client demands.
The combination of reduced snowpack and prolonged dry periods exacerbates future water scarcity issues.

Inflows – Less water available for customers
One particularly important impact may be the decrease in surface water availability for irrigated agriculture.
Over the next 50 years for the median scenario, available water (inflows) on average will be reduced in both the snowmelt season (April–July) and the full year.
The simulations indicated that reduced inflows are a result of warmer temperatures, reduced snow, and dryer soils, but not a result of changes in precipitation quantities. The reduction of inflows can result in in-creased frequency and duration of drought conditions.
